RSS

November 2022 Greater Vancouver Real Estate Market Update


The November 2022 real estate market in Greater Vancouver continued its measured pace, reflecting the impact of higher borrowing costs and broader economic uncertainty. With both buyers and sellers adjusting to changing conditions, activity levels remained below historical averages but showcased pockets of opportunity across different property types and regions.

The Real Estate Board of Greater Vancouver (REBGV) reported 1,614 home sales in November 2022, a significant 52.9% decrease compared to November 2021. While sales were down 15.2% from October 2022, they remained 36.9% below the 10-year seasonal average, highlighting a quieter market as the year winds down.


Key Market Trends

  • New Listings: November saw 3,055 new listings, a decline of 22.9% year-over-year and down 24.2% from October 2022, as many sellers opted to hold off during the slower market conditions.

  • Active Listings: Total active listings across all property types stood at 9,179, reflecting a 28.5% increase year-over-year but still below long-term norms.

  • MLS® Benchmark Price: The composite benchmark price for all residential properties was $1,131,600, reflecting a 0.6% month-over-month decrease and a 10.2% decline from the peak reached earlier in 2022.


Sales-to-Active Listings Ratios

The sales-to-active listings ratio—a key indicator of market conditions—varied across property types:

  • Detached homes: 11.2% (approaching buyer’s market territory)

  • Townhomes: 16.8% (balanced market)

  • Apartments: 19.8% (leaning toward a seller’s market)

Historical data suggests that downward pressure on home prices occurs when the ratio dips below 12% for a sustained period. This trend was particularly evident in detached home segments across several areas.


Regional Highlights

Burnaby

  • Detached homes: Benchmark prices in Burnaby South decreased to $1,998,600, down 1.2% month-over-month and 8.7% year-over-year.

  • Apartments: Burnaby North showed resilience, with benchmark prices at $664,200, reflecting modest month-over-month declines but stable year-over-year figures.

New Westminster

  • The benchmark price for apartments remained at $618,000, showing minimal change from October, while detached homes declined to $1,400,100, reflecting a 7.9% year-over-year drop.

Vancouver East & Vancouver West

  • Vancouver East: Apartments saw a benchmark price of $668,500, down 1.2% from October 2022. Detached homes dipped further to $1,730,300, reflecting the broad impact of economic conditions.

  • Vancouver West: Apartments maintained a benchmark price of $820,000, while detached homes recorded a significant decline, now at $3,267,400, down 9.8% from earlier in the year.

Tri-Cities (Coquitlam, Port Moody, and Port Coquitlam)

  • Coquitlam: Detached homes dropped to a benchmark price of $1,718,200, with apartments stable at $652,800.

  • Port Moody: Apartments remain in demand, with benchmark prices holding steady at $702,100.

  • Port Coquitlam: Detached homes benchmarked at $1,440,000, reflecting consistent performance in this area despite broader challenges.


Opportunities for Buyers and Sellers

  • For Buyers: The current market offers increased selection and softer prices, particularly in the detached home segment. With less competition, now is an ideal time for buyers to explore options and negotiate favorable terms.

  • For Sellers: Strategic pricing and presentation are critical. Townhomes and apartments remain the strongest-performing segments, especially in Burnaby and Vancouver East, where demand has stayed relatively resilient.


Looking Ahead

November 2022’s numbers underscore the shift toward a more balanced market, with specific opportunities for buyers to secure properties at competitive prices. Sellers can still achieve favorable results with the right strategy, particularly in sought-after property types and areas.

If you’re considering buying or selling, I’m here to help you navigate these conditions with confidence. Contact me today to discuss your goals and develop a plan tailored to your needs.


Read

October 2022 Greater Vancouver Real Estate Market Update

The October 2022 real estate market in Metro Vancouver painted a picture of caution as inflation and rising interest rates continued to dominate headlines. While the month experienced a slight uptick in sales compared to September, the overall activity remained significantly below the historical norms.

The Real Estate Board of Greater Vancouver (REBGV) reported 1,903 home sales in October, marking a 45.5% decrease from October 2021 but a 12.8% increase from the previous month. However, this figure sits 33.3% below the 10-year October sales average, underscoring a slower market pace influenced by macroeconomic factors.

A Market Adjusting to Economic Pressures

Inflationary concerns and the Bank of Canada's rising interest rates prompted both buyers and sellers to carefully reassess their options. The increase in active listings—now at 9,852 properties, up 22.6% from October 2021—has shifted the dynamic, providing more selection for buyers while applying downward pressure on prices.

  • The MLS® Home Price Index composite benchmark for all residential properties sat at $1,148,900, reflecting a 2.1% year-over-year increase but a 9.2% decline over the past six months.

Sales-to-Active Listings Ratios

For October 2022, the sales-to-active listings ratio hovered at 19.3% across all property types, close to the balanced market threshold. However, performance varied by property type:

  • Detached homes: 14.3%

  • Townhomes: 21.6%

  • Apartments: 23.2%

This data suggests that while prices have softened from their peak earlier in the year, townhomes and apartments have maintained relatively stronger demand.

Spotlight on Key Areas

Focusing on our core service areas, the October market provided some nuanced trends:

  • Burnaby North: The benchmark price for all residential properties was $994,400, with a modest 4.8% year-over-year price growth despite a slower pace of sales.

  • Vancouver East: A benchmark price of $1,127,300, representing a small 0.4% year-over-year increase but a notable 10% decline over the past six months.

  • New Westminster: Resilient with a 7.4% year-over-year price increase, benchmark prices reached $809,800.

  • Coquitlam, Port Moody, and Port Coquitlam (Tri-Cities): The area saw mixed results, with Port Moody showing a strong 7.6% annual increase to $1,117,500, though sales volumes have eased across the region.

What This Means for Buyers and Sellers

The market’s shift provides opportunities and challenges:

  • Buyers: With increased inventory and more time for due diligence, buyers are in a stronger position to negotiate favorable terms. Securing financing early remains critical as further rate hikes loom.

  • Sellers: Pricing remains pivotal. While the market is no longer at the frenzied highs of spring 2022, accurate pricing based on current market conditions can still generate interest and achieve favorable results.

A Changing Landscape

October 2022 marked a transitional phase in the Metro Vancouver market. The balance of power between buyers and sellers is shifting, creating a more measured environment. As we head into the final months of the year, staying informed and proactive will be key to navigating the evolving real estate market.

For tailored advice or to discuss how these trends impact your buying or selling journey, feel free to contact me directly. I’m here to help you make informed decisions in every market condition.


Read

September 2022 Real Estate Market Update

As we reflect on September 2022, the Greater Vancouver real estate market continued to adjust to shifting economic conditions, marked by higher borrowing costs and evolving buyer activity. Home sellers took center stage, with an increase in new listings compared to August, but buyer demand lagged behind the region's long-term averages.

Key Highlights:

  • Home Sales: A total of 1,687 homes were sold in September 2022, representing a significant 46.4% decline from the 3,149 sales in September 2021. Sales were also down 9.8% compared to August 2022, standing 35.7% below the 10-year September average.

  • Listings Activity: September saw 4,229 new listings hit the market, an 18.2% drop compared to the same month in 2021 but a notable 27.1% increase from August 2022. This added inventory provides more choice for buyers navigating today’s market.

  • Benchmark Pricing:

    • The composite benchmark price across all property types was $1,155,300, reflecting a 3.9% increase year-over-year. However, prices continued to soften month-over-month, declining by 2.1%.

    • Detached homes held a benchmark price of $1,906,400, down 2.4% from August 2022.

    • Apartments recorded a benchmark price of $728,500, a 1.6% decrease month-over-month.

    • Townhouses remained resilient, with a benchmark price of $1,048,900, declining 1.9% from the previous month.

Market Trends by Region:

In our focus areas, market dynamics demonstrated unique patterns:

  • Burnaby: Detached homes saw a benchmark price decline, with Burnaby South registering a 1.2% dip month-over-month to $2,079,400. Apartments in Burnaby North maintained relative stability, with a benchmark price of $707,700.

  • New Westminster: Prices for apartments dropped slightly, with a benchmark of $633,800, reflecting a 2.6% month-over-month decline.

  • Vancouver East & West: Vancouver East apartments settled at a benchmark of $686,900, while Vancouver West saw a slight decline to $822,300.

  • Tri-Cities (Coquitlam, Port Moody, and Port Coquitlam): Apartments in Coquitlam experienced a 1.1% dip to $661,900, while Port Moody’s apartments fared better, declining only 1.3% month-over-month to $710,200.

What This Means for Buyers and Sellers:

The sales-to-active listings ratio for September sat at 16.9%, indicating a balanced market but with reduced competition compared to the intense demand seen in 2021. Notably, townhomes and apartments performed best, with ratios of 18.4% and 20.9%, respectively. This metric reinforces the opportunity for buyers to take their time making decisions while sellers should align expectations with market realities.

With borrowing costs rising due to the Bank of Canada’s efforts to curb inflation, affordability remains a critical factor. Buyers are encouraged to consult with mortgage advisors to understand their purchasing power, while sellers benefit from customized strategies that maximize property exposure.

Final Thoughts:

September 2022 provided a glimpse into a market recalibrating to economic changes. Whether you're considering buying, selling, or simply assessing your next move, staying informed and working with trusted professionals ensures you’re ready to navigate these conditions effectively.

For personalized advice tailored to your goals, reach out to us today. We’re here to help you make sense of the current market and make confident decisions.


Read

August 2022 Metro Vancouver Real Estate Market Update

As we transition from summer into fall, the real estate market in Metro Vancouver continues to evolve amidst changing economic conditions. The latest data from the Real Estate Board of Greater Vancouver (REBGV) reveals a quieter summer season, with reduced activity among both buyers and sellers, reflecting a shift towards a more balanced market.

Market Snapshot for August 2022

In August, residential home sales across Metro Vancouver totaled 1,870—a 40.7% decrease from August 2021 and a slight 0.9% drop compared to July 2022. While lower activity levels have been a recurring theme this summer, they remain 29.2% below the 10-year average for August.

New listings have also slowed, with 3,328 properties added to the market—a 17.5% decrease compared to August 2021 and 16% fewer than July 2022. However, the total number of active listings stands at 9,662, representing a 7.3% increase year-over-year.

The sales-to-active listings ratio for August was 19.4%, indicating that while the market is not in a seller’s territory overall, specific segments—particularly townhomes (25.3%) and apartments (24.8%)—continue to outperform detached homes (12.2%).

Key Insights for Burnaby, New Westminster, Vancouver, and the Tri-Cities

Burnaby:

  • Detached home sales in Burnaby reached 80, marking a decline of 25.9% compared to last month.

  • Apartments, a core housing type in Burnaby, saw 244 sales, maintaining relative stability.

  • The benchmark price for detached homes in Burnaby North was $1,962,000, with a 5.5% drop over three months.

New Westminster:

  • Detached home sales held steady at 26, consistent with July, though significantly below the historical average.

  • Apartments, with a benchmark price of $651,000, experienced a modest 1.6% price drop month-over-month but remain up 13.9% year-over-year.

Vancouver East and Vancouver West:

  • Vancouver East's benchmark price for detached homes was $1,794,700, marking a 1.6% decrease from July.

  • Vancouver West apartments, a dominant property type, had a benchmark price of $829,700, reflecting a 1.7% decrease over the previous month.

Tri-Cities (Coquitlam, Port Moody, and Port Coquitlam):

  • Port Moody continues to demonstrate resilience, particularly in the townhouse market, with benchmark prices increasing by 4.1% over six months to $1,096,600.

  • Apartments in Coquitlam saw a modest decrease of 1.7% month-over-month, with a benchmark price of $669,200.

Price Trends and Buyer Behavior

The MLS® Home Price Index composite benchmark price for all residential properties in Metro Vancouver was $1,180,500—a 7.4% increase from August 2021 but a 2.2% decline compared to July 2022.

With inflationary pressures and rising interest rates, buyers and sellers are taking a more cautious approach. As market conditions stabilize, preparation and strategy have never been more important. For sellers, ensuring your home is positioned attractively in this evolving market is crucial. For buyers, understanding financing options and long-term trends can offer opportunities amidst shifting dynamics.

A Changing Landscape

The slowdown in sales activity aligns with the broader economic landscape, where rising interest rates and inflation have tempered demand. For sellers, this represents an opportunity to refine marketing strategies and appeal to motivated buyers. For buyers, the cooling market could mean more choices and less competition.

Ready to Navigate the Market?

Whether you’re considering selling your home or exploring buying opportunities, understanding the current market climate is essential. Contact me today for personalized insights and strategies tailored to your goals.


Read

This is the 21st edition of the annual Eastside Cultural Crawl in which local artists and tradespeople open their studio and shop doors to showcase their passions to the public. You'll find all sorts of incredible Vancouverites from painters, jewelers, furniture makers, weavers, potters, photographers, glassblowers, sculptures, printmakers, woodworkers and more.
 
The shops and studios open to public are within the area of South to North from 1st Avenue to the Waterfront and East to West from Victoria Drive to Columbia Street. The organizers have created a fabulous web app that allows you to view an interactive map that pinpoints all the Crawls participants. Here is a look at the print version but I recommend you check out this site while you're about town to find the closest point of interest: https://explore.culturecrawl.ca/


This year I am proud to say I know a few of the great exhibitors and would highly encourage you to check them out!

Noah Macleod of Macleod and Sons is a dear friend and an incredibly hard worker. Noah has a passion for woodworking and along with his partner, Vancouver Salvage, has created The Wood Hub at 1278 E Hastings where you will be able to find some of their great works and pieces on display.
 
 
You can find out more about Macleod and Sons along with Salvage Vancouvers schedule for the Crawl on the official website here: https://explore.culturecrawl.ca/building/51223
 
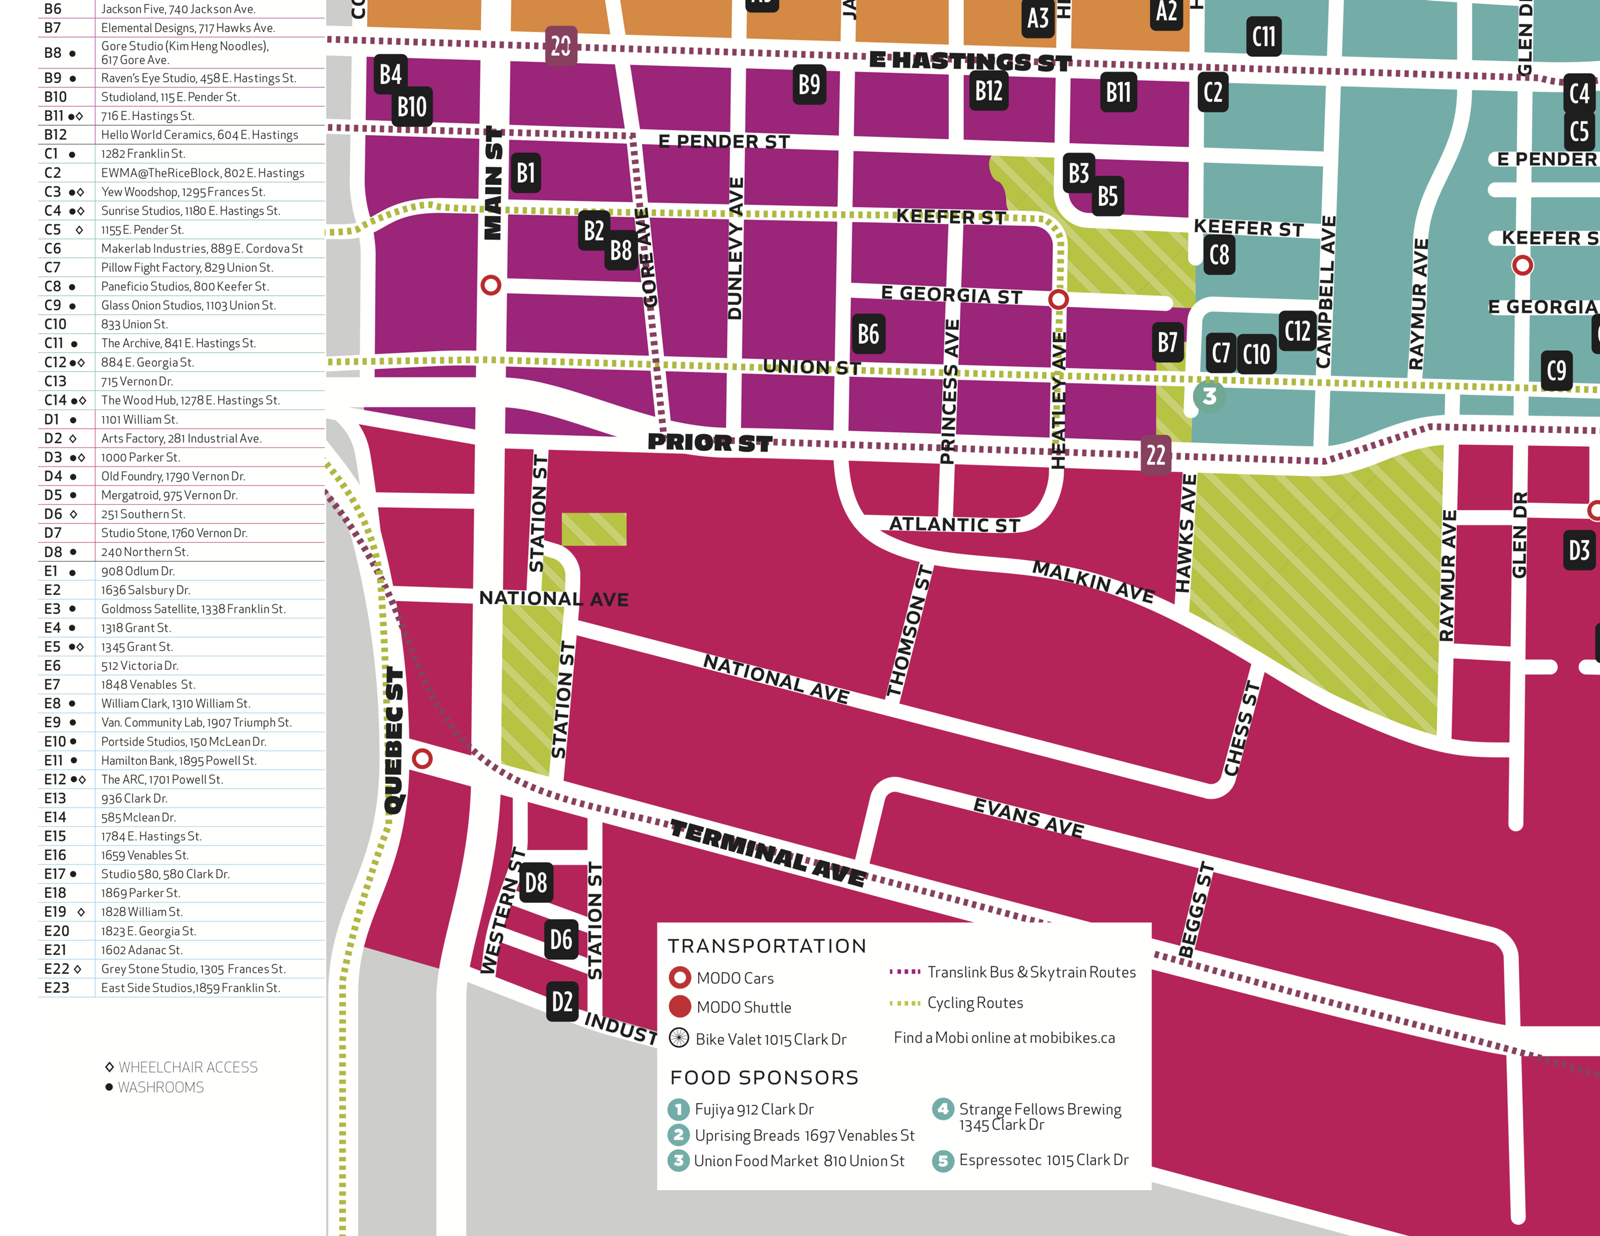
Another exhibitor to check-out if you're into woodworking and custom furniture is that of Zillion Design/Build at 716 E Hastings. Ben Burnett is an incredibly talented woodworker and all around great guy. I've seen some of his works first hand and the quality is striking. 
 
You can find out more about Zillion Design/Build schedule for the Crawl on the official website here: https://culturecrawl.ca/buildings/716-e-hastings
 
Hope you'll check out and enjoy this years Eastside Cultural Crawl. If you find anything special please do share!
Read

Downtown Vancouver Condo Market

 
The Downtown core of Vancouver saw more sales in August than we got in July while the inventory dropped to its lowest level since April this year.
 
Downtown, Yaletown and The Westend ended the month in Sellers Market territory with Sales-to-Active listing ratios from 24% to 28% thanks likely in large part to the near 10% drop in inventory.
 
Condos in the Downtown core priced under $800,000 are clearly the most desirable and saleable product in todays market. This would explain why Coal Harbour is the cores slowest moving market through August with 13 sales and a balanced market Sales-to-Active listing ratio of 14%.
 
As for the most desired type of unit in the Downtown it’s clearly the studio and 1-bedroom homes as this class is the only in Sellers Market territory making up over 50% of all sales Downtown Vancouver.
 

Westside Vancouver Detached Housing

 
57 Detached homes sold on the Westside of Vancouver during August keeping the market in neutral at a 8% Sales-to-Active listing ratio. This environment provides buyers of Westside homes an opportunity to search for homes more comfortably and expansively. 
 
Many Buyers within this marketplace are also Sellers within the market so it’s good to keep the old saying “a rising tide lifts all boats” as a lowering tide should have similiar effects on both sides of your transaction. There is however still areas within this market where advantage could be had on both ends of the transaction.
 
For instance, Kitsilano continues to be a bright light in the Detached housing market on the Westside. With 11 more houses selling in Kitsilano this past month a seller in this neighbourhood will enjoy more advantageous conditions than any other on the Westside.
 
There is 252 listings priced at $5 million or more on the Westside and just 9 sales of homes priced in this range. There is certainly Buyers out there for homes in this marketplace but they are looking for value, quality, and definitive “hang your hat” on qualities in a home that will help maintain their investments value.
 
Strong marketing the drives home a properties value proposition is a must to succeed.
 

Westside Vancouver Condo and Townhouse Market.

 
Total Sales of Westside strata-titeled properties fell for a second consecutive month with 157 homes selling in August. Inventory has also dropped in those months however so overall market conditions remain in Sellers territory.
 
Fairview, False Creek and Kitsilano are by far the most active neighbourhoods on the Westside making up 56% of total sales. There is a greater number of condos and townhouses in these areas that the market would consider to be more affordable which is driving sales for the most part here.
 
Homes priced under $1.75 million are all enjoying good selling conditions which suggests we’re still in the midst of a great move-up market.
 

East Vancouver Detached Housing

 
Despite a lower level of inventory East Vancouver detached homes saw Sales-to-Active listing ratio drop as total sales dropped for a third consecutive month. With August turning over just 7% of listing this market provides Buyers an upper hand.
 
How much land assembly listings effect these numbers is tough to say definitively but it’s certainly part of it as those listing raise the inventory providing appearances of a Buyers Market that may be less distinct than they’d appear in the stats.
 
Nonetheless, owners and developers of homes on the Eastside are having a real challenge selling homes/properties priced over $1.75 million. As noted before marketing that drives home a properties unique value proposition and shines light on value added qualities is a must to achieve success.
 
Seller’s best bets are in Killarney and Fraserview neighbourhoods. 
 
I’ll write on this in another post but the “Making Room” housing plan proposed and presented by the City of Vancouver at Open Houses recently will presumably help improve the value proposition of Eastside properties over the coming year.
 

East Vancouver Condo and Townhouse Market

 
Inventory of East Vancouver condos and townhouse dropped by 12% to 412 active listings from the high water mark for the year of 467. This marketplace has been a strong spot throughout the year as value has been the name of the game.
 
Mount Pleasant is rockin’ with 45 condo/townhouse sales in August leaving just 39% of active listings unsold for the month. The Sales-to-Active ratio rose by another 10% as it did in July to 61% in August.
 
This market could certainly provide sellers opportunity to move-up into the detached housing market should they wish.
 
If you have any questions about this information or how the current market conditions may effect your goals don’t hesitate to get in touch by hitting the “Contact Us” tab along the right side of the site. 

If you want a copy of our complete stats package complete the form below.
Read

There were seven properties reported as sold across Vancouver East this past week ending August 31st. 
 

Highest Sale Price for the Week

  • Fraser - Riley Park
  • Sold near $2.4 million
  • 33 foot frontage
  • Near 3,400 sq ft lot
  • 7-year old custom built
  • Slightly over 2,200 sq ft livable
 
The high sale for the week was within the Fraser sub-area just a few blocks off Main Street in a neighbourhood commonly referred to as Riley Park. Within a week of being on the market the home achieved a sale just above asking and just over $2.4 million. 
 
This was a beautiful, modern design, custom built home just seven years old in a fabulous location. With a shade over 2,200 square feet of living space, 2 bedrooms above the main and a legal 1-bed basement suite, features such as heated concrete floors and mountain views from the rooftop patio, this home was very well designed and of a very high quality build. 
 

Quickest Sale of the Week

  • Hastings East - near Kootney Loop
  • Sold in 2 days
  • Vancouver Special - Well Kept
  • Sold just under $1.3 million
  • Standard sized RS-1 zoned property
This home was an extremely well kept one-owner Vancouver Special built in 1970. After having been on the market once earlier in the year under different circumstances it was sharply priced just under $1.3 million and in only 2 days achieved full list price on the sale.
 
This is a neat location atop the hill, not far from the PNE, facing west towards Vancouver Harbour. These Vancouver Special homes offer a homeowner and/or investor a number of options should they wish to suite it or renovate into modern design.
 

Heritage Home Sale off Main Street

  • West of Main Neighbourhood
  • Near QE Park and Nat Bailey Stadium
  • Sold after 33 days on market
  • 115 years old
  • Standard Size lot - 33 foot frontage
  • Under 1,500 square feet living space
  • Sold at nearly $1.7 million
This is a very neat, comfortable and well kept old home in amongst Vancouver Easts most desirable neighbourhoods. Just a short walk to Vancouver Canadians Games at Nat Bailey and brunch/lunch/dinner up and down Main Street the lifestyle provided by this location is very Vancouver and just great. 
 
The near 1,500 square feet is on the small side but did provide 2 bedrooms above the main. Main floor was little over 700 square feet but very comfortable living with kitchen and eating area door to back yard.
 
 
For full details on these sales email adam@adamgoss.ca
Read

Downtown Vancouver Condo and Townhouse Market

 
The Downtown Vancouver Attached housing market saw very similar conditions to those experienced last month. While the market remains in what would be considered Balanced Market territory July marked the 3rd consecutive month of reduced sales activity. The 153 sales within Vancouvers Downtown during July is 40% lower than the 256 in the same month last year. The buying public is simply not willing or able to move on purchases as they were in months and years past.
 
Expect to see much of the same in August as prospective buyers take more time to transact with the greater wider variety of homes available. There should certainly be some deals to be had out there as motivating factors differ from seller to seller with those needing a sale more likely to meet the buyers demands.
 
The West End was the best market for Sellers with a 33% Sales-to-Active ratio in Sellers market territory while Yaletown was the most advantageous marketplace in Downtown Vancouver for the Buyer with a Sales-to-Active ratio in balanced territory at 15%.
 

Quick Stats on the Downtown Vancouver Condo and Townhouse Market

- Highest Sale Price achieved was $4.5 million
- Highest Sale by Price-per-Foot was $2,039.97
- Average per-foot price was $1,062
- 153 total sales
- Median Sales Price down 7% from June '18
- 12 fewer sales in July than June '18
- 40% fewer sales in July '18 as compared to July '17
- Inventory remained steady at 687 active listing

The Westside Vancouver Detached and Single-Family Market

 
Median Sale Price across the Westside of Vancouver dropped for the second consecutive month and for the 5th month of 7 this year. This is a consistent trend as the vast majority of sales activity throughout the Westside of Vancouver is occurring in price ranges below $4.5 million. In fact, more than 84% of the 460 sales on the Westside through July 2018 have been entered into at $4.5 million or less. 
 
Here is an interactive display of the MLS Housing Price Index for Vancouver West Detached Housing
Another consistent trend within the Westside Detached Market is the increasing amount of time it is taking to sell higher priced homes. With the mass majority of the buying public searching in the price ranges below $4.5 million it's interesting to note the difference in Days on Market as home values escalate:
 
- Properties valued $3 million and under to on average 37 days to sell
- Properties valued between $3 and $3.5 million took on average 36 days to sell
- Properties valued between $3.5 and $4 million took on average 41 days to sell
- Properties valued between $4 and $4.5 million took on average 51 days to sell
- Properties valued between $4.5 and $5 million took on average 98 days to sell
 
While it is entirely understandable that it takes longer to sell much more expensive product this appears to be evidence of buyers reluctance to go beyond the $4.5 million mark.
 
Here is an interactive display of the average Days on Market required to sell Westside Vancouver properties:

Quick stats of note for Westside Vancouver Detached Housing:

- Highest Sale Price in July 2018 was $5 million (2 sales; Arbutus and Dunbar)
- 19 fewer listings available vs June as inventory dropped to 761 active listings
- 28% fewer homes sold in July as compared to June with 57 total sales
- 21% fewer sales as compared to July 2017 when 72 homes sold in the month
- 8% increase in inventory as compared to July 2017
- Median Sale Price on the Westside of Vancouver decreased by 25% as compared to July 2017
- At this time last year it took on average 18 days less time on market to achieve a sale.
 

Vancouver East Detached and Single-Family Housing Market

 
In very similar fashion to last months sales numbers the Vancouver East Detached market saw just two-thirds the number of total sales as the month previous. In June '18 the month-over-month total sales were down 30%. While it's not alarming to see just the 67 total sales based upon the trends we've been witnessing in the market. It is quite an eye opening drop when viewed against sales numbers over the past decade. Over the last ten-years it is most common to see total sales in the month of July between 110 and 150 on the Eastside of Vancouver.
 
Renfrew Heights remains a steady performing area with the same 47 listing inventory and 10 sales as last month. Those ten-sales were the most of any East Vancouver sub-area this past month.
 
Buyers market conditions were seen in the following neighbourhoods:
- Collingwood with 109 available listings and 3 sales
- Grandview with 64 listings and 1 sale
- Renfrew with 120 listings and 7 sales
- South Vancouver with 90 listings and 5 sales
- Victoria with 51 listings and just 1 sale
 

Quick stats of note for Eastside Vancouver Detached Housing:

- 67 total sales in July
- 50% less sales than 10-year average for July
- Median Sales Price of $1,528,000 increased 2% from previous month
- Median Sales Price is 3.2% lower than July '17
- Inventory moved lower to 786 total listings
 
For more info and/or for details on how the current market environment effects your purchasing or selling goals contact me anytime.
Read

The housing market continues to leave us asking more questions this year than it is answering. This reminds me of an Adam Robinson quote I heard in a recent Tim Ferris podcast in which he's discussing the effect of investors over analysis of markets ending with "... the world always makes sense, we just don't understand it". While our market may leave many of us wondering what factors are impacting sales, prices, and the like, it's the combination of many, many, more inputs, both macro and micro, that determines the results/conditions we are seeing. 

 
In last months update I had noted that there appeared to be some change in the air as the detached housing market had seen a considerable uptick in sales. Well, sales of detached housing on both Vancouvers East and Westside saw a decrease in sales activity.
  • Vancouver East saw 140 homes sell in May and just 98 in June.
  • Vancouver West saw 91 homes sell in May and just 79 in June.
Inventory levels of detached homes haven't increased significantly so Vancouvers single-family detached market remains in balanced market territory.
 
Sales of condos and townhouses, the segment of the market we've seen the strongest sellers market conditions throughout 2018, continues to be favourable to the seller in most areas of the city. While sales were down in the attached market city wide the sales-to-active ratio would still suggest the conditions favour the seller and may well have upward pressure on prices. 
  • Fairview saw 55 units sell in June and with an inventory of 98 listings is staunchly in Sellers market territory.
  • Kitsilano with 101 listings available and 38 sales in June is also very much in Sellers market territory.
 
Buyers in todays market are still very clearly seeking out value.
 
On the Westside of Vancouver the mark in June was $1.25 million for attached homes where we see a precipitous drop off in sales-to-active ratios. Condos and townhomes priced under this market accounted for 82% of total sales in June.
  • Attached product on the westside priced under $1.25 million currently at 48% sales-to-active ratio (375 listings / 180 sales)
  • Attached product on the westside priced over $1.25 million currently at 12% sales-to-active ratio (314 listings / 39 sales)
On the Eastside of Vancouver this mark in June was $900k. Condos and Townhouses priced under this mark accounted for 84% of total attached sales for the month of June.
  • Attached product on the eastside priced under $900k currently at 48% sales-to-active ratio (298 listings / 144 sales)
  • Attached product on the eastside priced over $900k currently at 22% sales-to-active ratio (121 listings / 27 sales)
In Downtown Vancouver this mark in June was $1.5 million. Condos and Townhomes priced under this mark accounted for 86% of all sales in the downtown in June. 
  • Attached product in Downtown Vancouver priced under $1.5 million currently at 32% sales-to-active ratio (422 listings / 135 sales)
  • Attached product in Downtown Vancouver priced over $1.5 million currently at 8% sales-to-active ratio (265 listings / 21 sales)
These are pretty considerable differences in market conditions and what leads me to describe our current market as a fabulous "move-up" market. For instance, if you're an owner of a 1-bed condo in Downtown Vancouver you may look to take advantage of seller market conditions on the sale of your condo. Then, take advantage of buyer market conditions by moving up the property ladder and looking to buy a larger, more valuable, home elsewhere in the city.
 
To conclude, there is always opportunity to be found in every market. At this time I'd suggest those looking to increase the size and/or value of their current home are those that the current conditions are most advantageous to.
 
As always if you'd like to discuss your situation and goals; do not hesitate to get in touch.
Read

Leading into May as noted in previous updates we had been witnessing the Condo and Townhouse market in Vancouver outpace sales of detached single-family homes quite considerably. There may be a bit of change in the air based upon the most recent stats report received.

 
In the month of May conditions for buyers of Vancouver Condos and Townhomes have improved. While the numbers suggest we're still firmly in Sellers Market territory throughout the Downtown, Westside and Eastside of Vancouver, there is certainly more competition in the marketplace today that is providing buyers many more opportunities. Inventory levels in all these areas increased in the month of May:
 
  • Vancouver Eastside from 340 active listings in April to 399 to end May.
  • Vancouver Westside from 509 active listings in April to 657 to end May.
  • Downtown Vancouver from 554 active listings in April to 672 to end May.
 
Total number of sales were marginally less in each area in May than they were in April as well thus leaving more available units for sale on the market for buyers to ponder. 
 
The result is that sellers and agents will need to be sharper with their pricing strategy and make sure get educated on the conditions within their specific market. As I've noted in the past if you have a 1,500 sq ft Coal Harbour condo you're market is experiencing distinctly different conditions than those of a West End seller of a 1 bedroom condo. You'll want to make certain not to assume that because the sales ratio in the Downtown is at 36% that means you can price well ahead of the market. That number is misleading... that later example, West End 1 bed owner, will face definitive sellers market conditions as 65% of attached home listings priced under $1.25 million in the Downtown sold in May. Meanwhile only 14% of listings priced over $1.25 million sold through the month of May. Those are considerably different environments for the seller and will require different strategies to be most successful.
 
Meanwhile the slumping detached / single-family housing market of months past is improving considerably. With the appreciation of condo prices, reduced average value of homes on the Westside and more or less stagnant values of homes on the Eastside it appears as though buyers are seeing value again in owning Vancouver land.
  • Sales of Detached homes on the Eastside of Vancouver improved from 103 sales in April to 140 sales in May.
  • Sales of Detached homes on the Westside of Vancouver increased from 70 sales in April to 91 sales in May.
This has to be very welcomed news to detached homeowners across the City of Vancouver. Most opportune areas for Vancouver detached homeowners are:
 
Westside Vancouver
  • Kitsilano which is sold off 27% of inventory in May
  • Cambie neighbourhood which sold 19% of it's inventory in May
  • Homes priced between $3 to $3.5 million saw 23% of inventory sell
  • Homes priced between $1.5 million and $2.75 million saw 36% of listings sell.
Vancouver Eastside
  • Mount Pleasant with low inventory and strong sales had 35% of inventory move.
  • Main neighbourhood with more sales but more inventory saw 31% of it's listings sell in May
  • Anything valued at $1.75 million or below is in high demand with 28% of all listings in this range selling in May.
If you're interested to learn more about how any of this effects your homes value or the competition level you'll be facing on your purchase.. do not hesitate to reach out as I am always happy to help.
 
Have a wonderful day all!
Read

With limited of spacious view homes remaining purchasers of 3-bedroom condos at The Pacific will receive a $50,000 purchase incentive now through Sunday May 20th.
 
These three-bedroom units at The Pacific will be a truly special place to call home and you may be assured of a quality build with Grosvenors at the helm. They range in size from 1256 to 1590 square feet along with between 152 to 217 square feet of outdoor space and will be located on the 20th floor or above.
 
You can find and download the floorplans for these units here: 3-bedroom Floorplans
 
Units are outfitted with top-of-the-line finishings including:
  • Gas cooktops by Wolf
  • Convection Ovens by Wolf
  • Microwaves by Wolf
  • Refrigerators by Sub-Zero
  • Wine Fridges by Sub-Zero
  • Dishwashers by Miele
  • Full height pull-out pantries by Snaidero
  • Washer and Dryer by Miele
  • Custom Closet by Snaidero
Read

This past April was another month of interesting competition within the Vancouver Real Estate market. In certain areas and price ranges we're seeing real competition amongst buyers while in other areas we're seeing fierce competition amongst sellers for the few buyers. It remains in my opinion a very good market for those seeking to move-up the property ladder.
 

The Kitsilano area continues to be among Vancouvers' most desirable neighbourhoods for buyers in todays market; leading all neighbourhoods on the Westside with 48 condo/townhome sales in the month of April. With 6.7 of 10 attached listings selling in April the neighbourhood has now seen similar sellers market conditions for the past 39 months. During this time the MLS HPI Benchmark Price for condos has grown by 62% while townhomes have increased in value by 55%.

All Downtown neighbourhoods remain steadily within sellers market territory as they were at the end of March. Downtown turned over 34% of it’s 211 listings in the month with the entire core of Yaletown (56 sales), Westend (44 sales), Coal Harbour (27 Sales) seeing 199 total sales and a 36% sales ratio overall.
 
While these numbers suggest strong competition throughout the Downtown market as well as the neighbourhoods of Kitsilano and Mount Pleasant it is important to note not all owners in these areas, and the rest of the city for that matter, will have the same experience within the marketplace.
 
For instance, 3 and 4 Bedroom product is having a tougher time finding buyers with just 9 of the 95 listings Downtown Vancouver selling. Owners of these homes, along with those with homes valued above $2 million will require stronger pricing strategies in tandem with strong marketing to achieve the best price possible.
 
Through April we continue to see this trend which is that we really have a tale of two markets. Owners of Westside Vancouver homes, specifically those homes valued at $2.75 million or more, are really battling for the active buyers in the market place. 4 of 7 sales on the Westside of Vancouver are priced over $2.75 million, however, an incredible 688 of the 799 homes currently available for sale on the Westside are in that same price range. That makes for a sales-ratio near 5% in the $2.75 million and up range on the Westside. This makes for buyers market conditions and most likely downward pressure on prices. 
 
While in my opinion all homeowners in need of selling should explore their options and choose the services of a professional Realtor with a well conceived pricing strategy and marketing plan if they wish to achieve the best price possible. It is most important for those needing to sell detached homes valued above the median across Vancouver today as the old 3P tactics employed by some of putting a sign in the ground, put it on MLS, and pray for a buyer simply are not going to get a result in this environment.
 
If you'd like a copy of our detailed market report simply email adam@adamgoss.ca
Read